It can be easy to get overwhelmed with all of the Google Analytics stats that present themselves when you start clicking around… but there a few we recommend keeping an eye on so you can get a good picture of what’s going on on your website!
Traffic Source/Medium
Acquisition > All traffic > Source/Medium:
Google: “Source/Medium describes where your traffic comes from. The Source is the place users are before seeing your content, like a search engine or another website. The Medium describes how users arrived at your content. Values for Medium include “organic” for unpaid search traffic and “none” for direct traffic. Custom values you define for Source and Medium will also be included in this dimension.”
Obviously, you want to know where most of your traffic is coming from. When you click through to this screen, you will see your top referrers in a list from most users to least. You will here be able to assess which methods are bringing in the most traffic to your site, like google/organic search, Facebook, Facebook Ads, AdWords (Google CPC) and any other referer. For each of these, you will be able to see the pages per session, the average session duration and much more. From this screen, you can see all of your users and adjust the dates to see data from different time periods, and even compare to other time periods.
It is important to remember though, if you are spending a lot of money on Google Ads, then, of course, most of your traffic will be coming from there. Same with Facebook ads. Keep this in mind when analyzing your data and remember, you might be down if you compare week to week, but if you are spending considerably less, then the drop makes perfect sense.
Bounce Rate:
Acquisition > All traffic > Channels
Google: “The percentage of single-page sessions in which there was no interaction with the page. A bounced session has a duration of 0 seconds. “
Of course, the last thing you want is to spend time and money in an effort to get users to your site and then spend no time looking around. This could mean a few things. Maybe your website is too slow to load. Maybe your ads aren’t targeted enough? Take a look into this and try to minimise your bounce rate as much as possible.
Conversion rate:
Conversions > Goals > Overview
Google: “Goals measure how well your site or app fulfills your target objectives. A goal represents a completed activity, called a conversion, that contributes to the success of your business. Examples of goals include making a purchase (for an ecommerce site), completing a game level (for a mobile gaming app), or submitting a contact information form (for a marketing or lead generation site).”
Whether you have 12 goals set up on your site or a single goal (like getting people to contact you), it’s so important to know your conversion rate and continuously work to make that improvement. Maybe you need to shorten your contact form, maybe you need to add some testimonials or a map. It’s all about getting that conversion rate as high as it could possibly be. If you don’t have even one goal set up, then it’s time to get yourself set up by a professional.

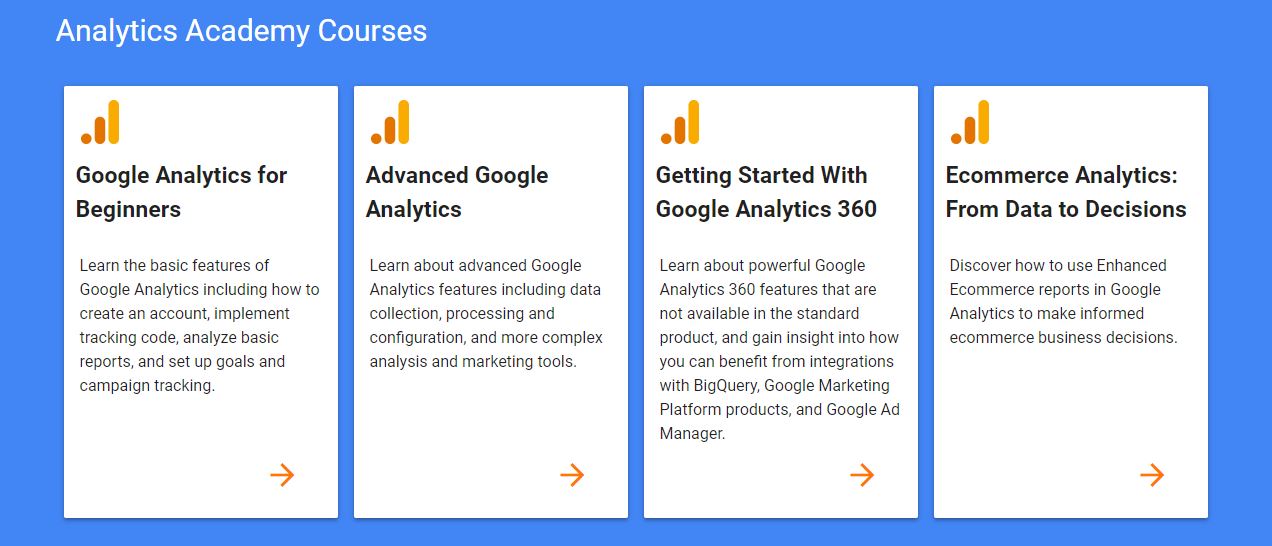
Of course, if you are already very knowledgeable on these three metrics, what they mean and how to find them, then we recommend moving deeper and starting the Google Analytics Academy courses. There are courses for beginners, advanced users, and even people looking to learn more about ecommerce analytics.


